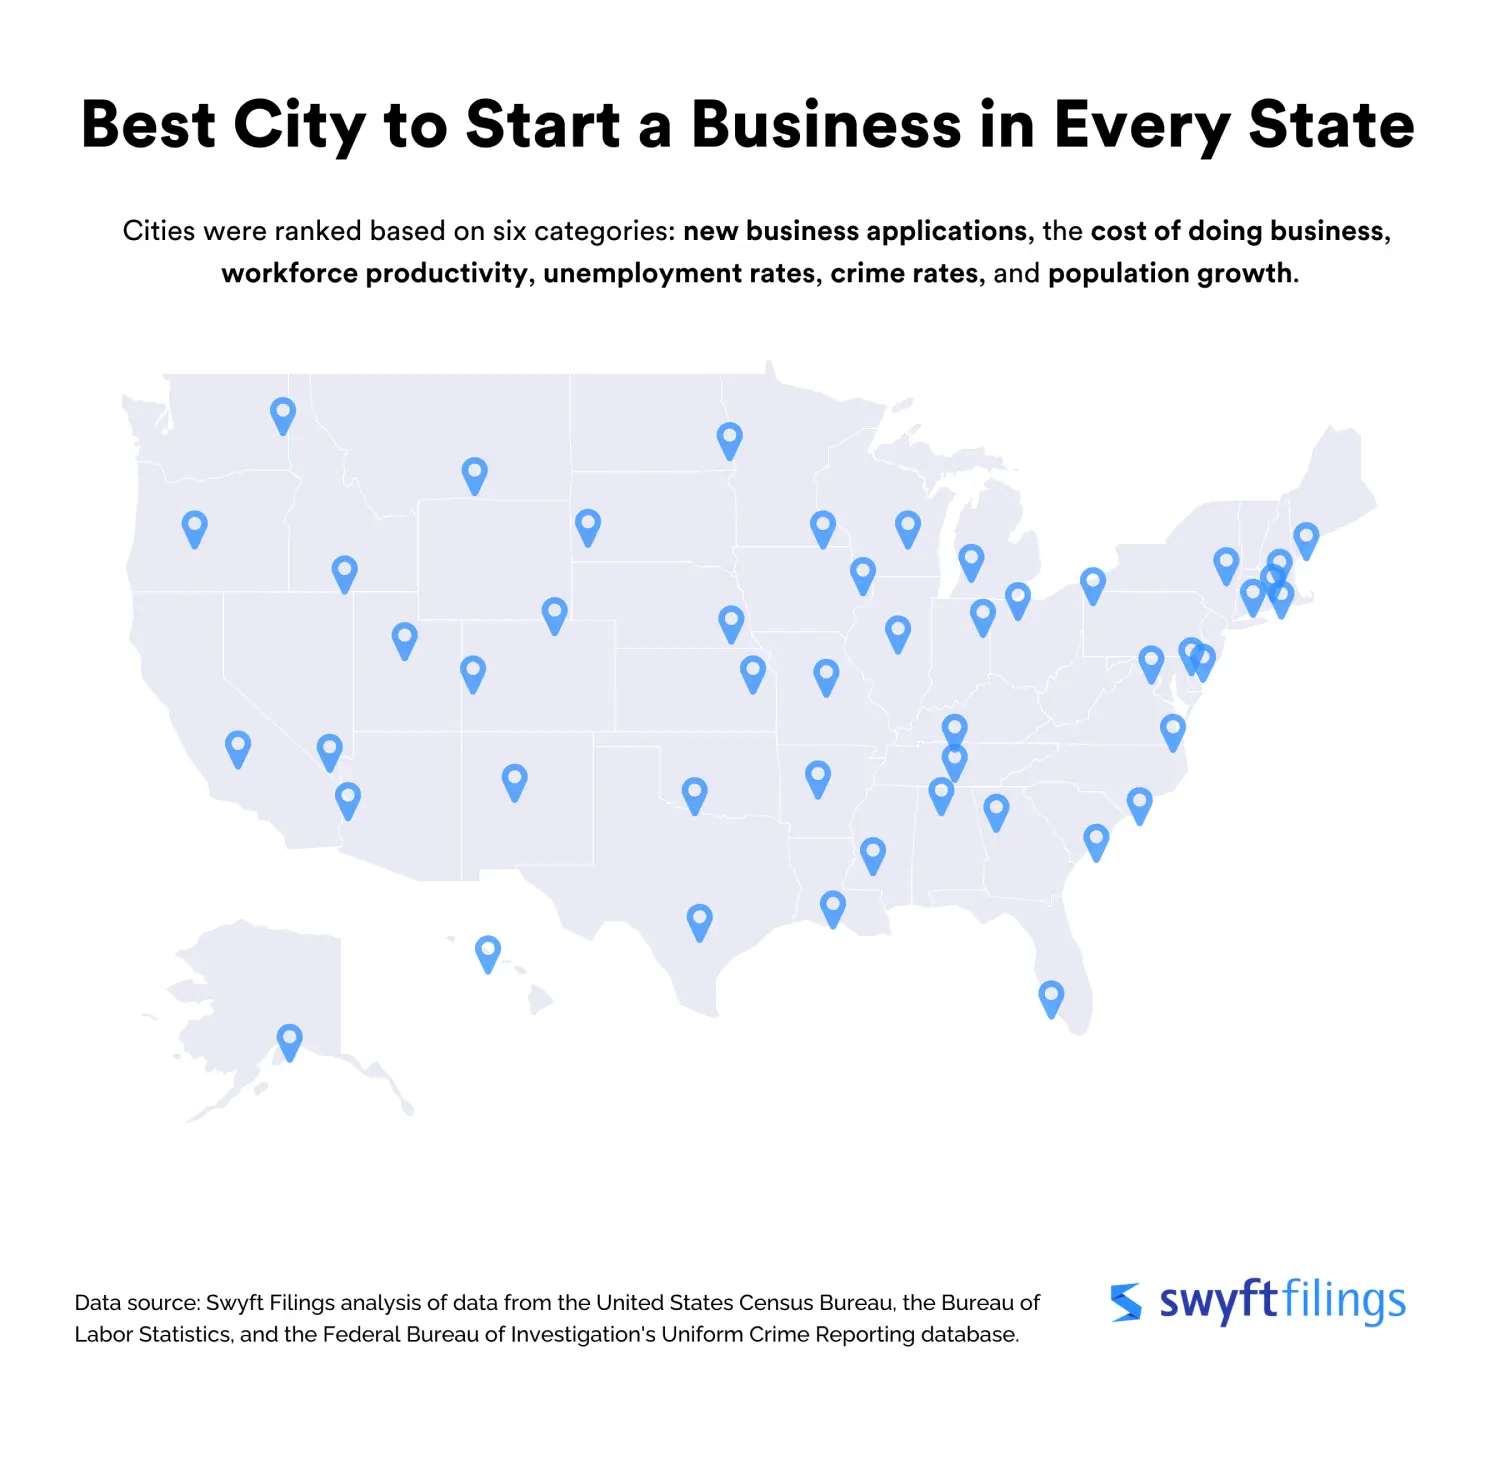
The Best City in Each State to Start a Business
Based on the most recent data, these are the best cities in each state to start a new business.
Starting a new business can be an exhilarating yet daunting journey. Inherent to each new business venture lies the challenge of navigating opportunity and risk, and unfortunately, nearly half of all new businesses fail by the end of their fifth year [1]. Amidst these odds, the location of a business can influence its chances of long-term survival and prosperity.
While traditionally, major urban centers have been seen as the go-to for startups, the findings of this analysis suggest otherwise. Many of the top cities for businesses this year are not the largest in their states but instead, have a much more modest population size. These smaller cities offer distinct advantages: tight-knit communities foster deeper local networking, and lower operational costs and less market saturation allow new businesses to establish themselves more swiftly and gain a loyal customer base.
To identify the best city in every state to start a business, the data and research team at Swyft Filings, a business formation service, referred to the most recent data from the United States Census Bureau, the Bureau of Labor Statistics, and other government sources. They evaluated all cities in the U.S. with a population over 50,000 on factors that can play a key role in influencing business success, including the cost of doing business, workforce productivity, crime rates, and population growth.

Key Findings
Entrepreneurship tends to fare better in cities overall: In 2022, about 1.5% of Americans, or 15 out of every 1,000 people, submitted a new business application. While this marks a notable engagement in entrepreneurial activities, business applications across the United States decreased by 6.2% from 2021-2022. However, cities fared somewhat better, where the average decline in business applications during the same period was 5.8%, and the number of business applications per capita surpassed the national average, coming in at 1.7%, or 17 out of every 1,000 people.
Population growth and new business applications are positively correlated: Perhaps unsurprisingly, an analysis of all cities in the U.S. with a population above 50,000 revealed a slight positive correlation between population growth from 2021-2022 and the growth in business applications filed during the same period, Pearson’s r = 0.29. In other words, cities experiencing population growth also saw a rise in new business applications during the same period. However, it is important to note that this correlation does not necessarily illustrate a direct cause-and-effect relationship, and further research may be required to delineate the nuanced dynamics at play.
More business applications, less unemployment: Analysts at Swyft Filings uncovered a slight negative correlation between business applications per capita in 2022 and the unemployment rate in 2023, Pearson’s R = -0.23. While causation cannot be established from a correlation alone, this statistic suggests that cities with an above-average density of business applications filed in 2022 tended to see below-average unemployment rates in the subsequent year.
Methodology
To identify the best city in each state to start a business, the data and research team at Swyft Filings ranked cities with a population of 50,000 or more across six key dimensions: new business applications, the cost of doing business, workforce productivity, unemployment rates, crime rates, and population growth. Below is a percent breakdown of how the data from each category factored into the scoring system.
New business applications: 30%
New business applications, both per capita and their year-over-year change, provides a clear insight into the entrepreneurial climate of a city. A high volume suggests a thriving environment that fosters new business initiatives.
New business applications as a percentage of the population (2022) [2], [3].
Change in new business applications from 2021 to 2022 [3].
Cost of doing business: 15%
The proportion of household expenditures to income is a direct indicator of the affordability of starting and maintaining a business. Cities with lower operating costs may be more attractive to new business owners. Not only do they present fewer financial barriers to entry, but long-term, businesses may find it easier to cover operating costs, reinvest in growth, and withstand financial downturns.
Household expenditures as a proportion of income, 2022 [4].
Workforce productivity: 15%
Average weekly wages were used as a benchmark to gauge the productivity and effectiveness of the local workforce. A well-compensated workforce generally indicates a pool of talented professionals, which is crucial for the growth of any new business.
Average weekly wages, fourth Quarter, 2022 [5].
Unemployment rates: 10%
The current unemployment rate and year-over-year change in unemployment were used to evaluate the overall economic health of cities. Low unemployment rates suggest a robust economy and can also mean a competitive job market, which is vital for businesses looking for talent.
Crime rates: 15%
Safety is paramount for any new enterprise, and the local crime rate is a strong determinant of a city's overall business-friendliness. Cities with lower crime rates offer a more secure environment for businesses, employees, and customers.
Property and violent crime by metropolitan area, 2019 [8].
Population growth: 15%
The annual growth rate of a city's population reflects its desirability and potential market size. An upward trend indicates a vibrant community and a potential increase in the customer base, making it an enticing location for new businesses.
City and town population totals, 2020-2022 [9].
Note: Vermont and West Virginia were excluded from the analysis due to insufficient data.
The Best City in Each State to Start a Business
Alabama: Decatur
Alaska: Anchorage
Arizona: Lake Havasu City
It can take as little as 10 minutes to start an LLC online with Swyft Filings. Our experienced business specialists can help you save time and money while forming your LLC.
Arkansas: Conway
California: Visalia
Colorado: Grand Junction
Connecticut: Hartford
Delaware: Wilmington
Florida: Cape Coral
Georgia: Marietta
Hawaii: Honolulu
Idaho: Twin Falls
Illinois: Bloomington
Indiana: Fort Wayne
Start your business the right way by obtaining your federal tax ID EIN so you can open bank accounts, collect revenue, and hire new employees.
Iowa: Dubuque
Kansas: Topeka
Kentucky: Bowling Green
Louisiana: Lafayette
Maine: Portland
Maryland: Frederick
Massachusetts: Worcester
Michigan: Grand Rapids
Minnesota: Rochester
Mississippi: Jackson
Ensure you hit all of your filing deadlines, remain compliant, and maintain your privacy with the support of our registered agent services.
Missouri: Columbia
Montana: Billings
Nebraska: Lincoln
Nevada: North Las Vegas
New Hampshire: Nashua
New Jersey: Vineland
New Mexico: Albuquerque
New York: Schenectady
North Carolina: Wilmington
North Dakota: Fargo
Ohio: Toledo
Oklahoma: Lawton
Oregon: Bend
Pennsylvania: Erie
Rhode Island: Warwick
South Carolina: Charleston
South Dakota: Rapid City
Tennessee: Murfreesboro
Texas: New Braunfels
Utah: Provo
Virginia: Newport News
Washington: Spokane Valley
Wisconsin: Oshkosh
Wyoming: Cheyenne
Bibliography
Bureau of Labor Statistics. “Establishment Age and Survival Data.” Accessed August 18, 2023.
United States Census Bureau. “County Population Totals and Components of Change: 2020-2022.” Accessed July 19, 2023.
United States Census Bureau. “Business Formation Statistics - Annual County Data.” Accessed August 18, 2023.
United States Census Bureau. “Census Bureau Table - American Community Survey Financial Characteristics.” Accessed August 18, 2023.
United States Census Bureau. “Census Business Builder - Average Weekly Wages Location Quotient.” Accessed August 29, 2023.
United States Bureau of Labor Statistics. “Unemployment Rates for Metropolitan Areas.” Accessed August 18, 2023.
United States Bureau of Labor Statistics. “Over-the-Year Percent Change in Metropolitan Area Unemployment.” Accessed August 18, 2023.
Federal Bureau of Investigation. “Table 8 - Crime in the United States.” Accessed August 18, 2023.
United States Census Bureau. “City and Town Population Totals: 2020-2022.” Accessed August 18, 2023.
All charts, statistics, and findings on this page are free to use. We kindly request that you attribute any full or partial use to Swyft Filings with a link to this page. Thank you!
Swyft Blog
Everything you need to know about starting your business.
Each and every one of our customers is assigned a personal Business Specialist. You have their direct phone number and email. Have questions? Just call your personal Business Specialist. No need to wait in a pool of phone calls.


